Sunday, November 29, 2015
Wednesday, November 25, 2015
The Explosive Growth of Online Video, in 5 Charts
Digital video ad spend is growing at a rapid pace. According to a new report from eMarketer, the “Q2 2015 State of Video,” total ad spend allocated for digital video has jumped from 2.4 percent in 2013 to 4.4 percent today. Sixty-eight percent of U.S. marketers also plan to increase their digital video budgets in the next year.
As the report notes, this shift is due in part because of new video ad offerings from platforms like Snapchat, Yahoo, and Vessel. The report also emphasizes the proliferation of original video content on platforms like Hulu, YouTube, and Amazon as a key contributor to digital video ad spend’s rise.
Even existing cable networks like HBO and Showtime have seen audiences drop their cable packages for digital; in turn, they’re starting to offer standalone subscription services. Others—like ESPN, CNN, and Disney Channel—are joining digitally packaged services like Sling TV.
Media outlets aren’t the only ones that have to anticipate viewers’ changing habits, however. If marketers are to keep up, they need to adapt to these new digital habits and platforms.
For those who want to stay ahead of the curve, here are the top five takeaways from eMarketer’s report.
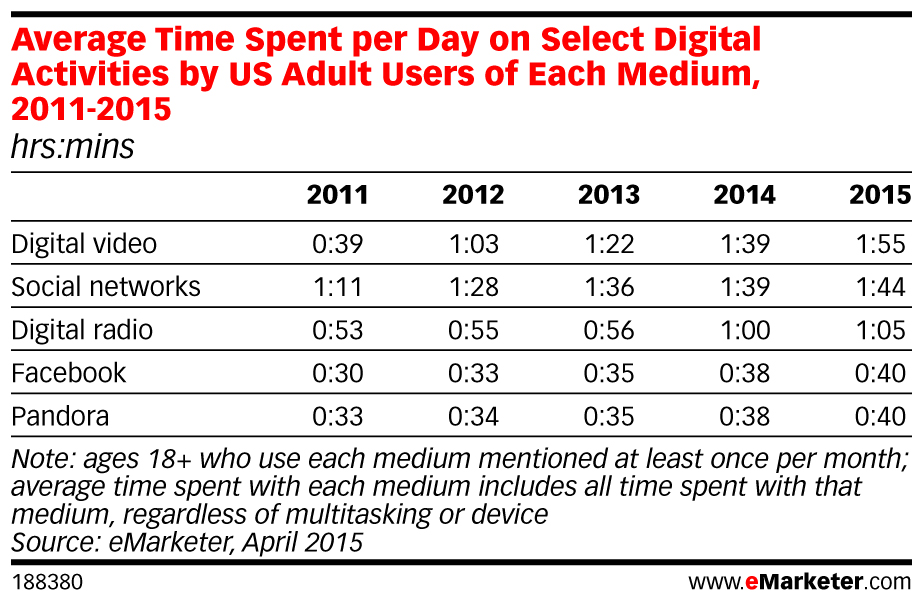
1. People spend more time with digital video than with social media
This is a landmark year for digital video. It tied with social media in 2014 when it comes to average time spent per day engaging with different digital activities. In 2015, digital video finally pulled ahead. Users are spending an average of 1:55 with digital video each day, and only 1:44 on social networks.
In fact, time spent with digital video now trumps time spent with all other listed digital platforms, including digital radio, Facebook, and Pandora.
2. Viewers are spending more time watching digital video than ever before
The time adults spend watching digital video each day has increased from 21 minutes in 2011 to one hour and 16 minutes in 2015. Meanwhile, time spent watching traditional TV has been decreasing steadily since 2012. This isn’t surprising, given that more and more viewers are watching their favorite shows through connected TV devices like Apple TV and Roku.
To pull ahead of the curve, marketers would be wise to experiment with content and advertising that’s custom-made for digital video, rather than copying and pasting their TV spots onto digital platforms.
3. Especially millennials
According to the report, “trailing millennials” (aged 14 to 25) are the only age group watching more shows on digital devices than on traditional TV screens.
Seventy-two percent of these trailing millennials also use digital streaming services—a higher percentage than any other age group.
As this generation of trailing millennials grows up, they will most likely come to expect that the best content be offered on digital platforms. The advertising that accompanies that content needs to be innovative enough to hold their fleeting attention.
4. Viewers love longform original content and user-generated live-streams
Viewer attention is in high demand, and there appears to be one secret to capturing it: longform original content. That’s the stuff of Netflix, Hulu, and Amazon Prime. All three started out as distribution platforms for licensed content, and all three eventually jumped into creating their own shows.
Meanwhile, video streaming apps like Periscope and Meerkat popped up almost overnight and started to gain traction this year, especially among millennials. A May 2015 study by Horizon Media found that 21 percent of U.S. Internet users would be interested in using Periscope or Meerkat; the majority of respondents were aged 18 to 34.
This boom of user generated content doesn’t mean longform content is leaving any time soon, however. As the report states, “It is a sign of the health and versatility of the digital video market that these and other types of content can coexist and present opportunities for marketers.”
5. Tablet use is soaring
What kind of devices are we watching all of this digital video on anyway? Increasingly, we’re using our tablets and smartphones. In fact, of the devices listed below, tablet use had the greatest annual growth from 2011 to 2015, at 120 percent. And we’re not just watching on the go. We’re also tuning into content on our connected TVs, otherwise known as smart TVs, with an increased usage rate of 23 percent.
While we still watch most of our digital videos on laptops and desktops, their growth stalled in 2015. Suffice it to say, the content world is going mobile, and digital video is no different.
The future of digital TV advertising, in 5 charts
The dominant players in online video advertising today are YouTube and other short-form content providers. But that won’t last much longer.
YouTube and its ilk will lose their lead to companies distributing television programming through “over-the-top” (OTT) connected devices, according to a new report from media research firm The Diffusion Group. That OTT programming is mostly the same long-form content people watch on a traditional TV broadcast — from AMC’s “The Walking Dead” to ESPN’s “SportsCenter” — but served through connected devices such as Roku, Apple TV and Chromecast that enable digital measurement and ad-serving.
The Diffusion Group report forecasts legacy TV advertising revenue will drop to $47.5 billion in 2018, while OTT TV ad revenue will rise to $31.5 billion during the same period. Jointly, that spells growth for the TV advertising market, even as traditional TV advertising budgets decline.
Right now, “OTT advertising is still lumped in with YouTube videos and ads on sites that have video,” said Alan Wolk, senior analyst at The Diffusion Group and author of the “Future of OTT TV Advertising” report. “By 2020, give or take, there will be no distinction between OTT and TV buying. If I’m Kraft, I will buy women 18 to 25 who are watching [ABC television series] ‘Scandal,’ and that ad will show up through OTT or set-top boxes. They’ll be bought and sold together.”

That current conception of OTT ads as online advertising leads to undervalued inventory, but the biggest element holding the sector back is lack of a unified measurement standard, said Wolk. While a number of companies are offering OTT measurement products, including Rentrak and Kantar, many in the industry are waiting on Nielsen’s solution, which it has been working on since 2013. Wolk expects it to finally arrive later this year, which is likely to prompt a major upswing in the value of OTT inventory.

But whatever Nielsen does, the dollars will eventually follow the viewers, who are spending an increasingly large amount of time consuming video programming through connected devices. Last year, the average U.S. consumer watched 3.6 hours of OTT content per week. The report forecasts that figure will nearly double to 6.9 hours this year, with steady increases each subsequent year through 2020.

Not all video content accessible through connected devices is 20 minutes or longer — watching a two-minute YouTube clip through a game console is still considered OTT viewership — but people gravitate toward lengthier content when they’re sitting on their couch, watching on an actual TV screen. FreeWheel’s recent video monetization report shows that 91 percent of OTT ad views occur on content longer than 20 minutes (or on live content, which tends to run longer than 20 minutes).

(Source: FreeWheel Video Monetization Report Q4 2014)
Across OTT platforms and channels, the average video ad load for a standard 30-minute show will increase from 3.2 minutes last year to 5.2 minutes by 2020, according to Wolk’s analysis. Alongside increased viewership as well as advances in OTT ad measurement and targeting, that will help drive substantial growth in OTT ad revenue over the coming years. That growth will be fastest in the next two years, as both multiplatform video providers (Comcast, Time Warner, etc.) and networks push their “TV Everywhere” applications on consumers, said Wolk.

Subscribe to:
Posts (Atom)